CorpusCallosum: cc_visualization.py
Visualize corpus callosum from template files.
usage: cc_visualization.py [-h]
                           (--template_dir TEMPLATE_DIR | --values_file VALUES_FILE)
                           --output_dir OUTPUT_DIR [--resolution RESOLUTION]
                           [--smoothing_window SMOOTHING_WINDOW]
                           [--colormap COLORMAP] [--color_range MIN MAX]
                           [--legend LEGEND] [--mode {thickness,p-value,icc}]
                           [--log_scale] [--upper_threshold VALUE]
                           [--threshold_color THRESHOLD_COLOR] [--title TITLE]
                           [--output_name FILENAME] [--twoD] [-v]
Named Arguments
- --template_dir
Path to a template directory containing per-slice files named thickness_values_<idx>.txt, and optionally contour_<idx>.txt and thickness_measurement_points_<idx>.txt. If contour_<idx>.txt and thickness_measurement_points_<idx>.txt are not provided, uses fsaverage template. For FreeSurfer surfaces in orig.mgz reference space, also provide mri/orig.mgz and mri/transforms/cc_up.lta in this directory.
- --values_file
One-column CSV containing values ordered anterior to posterior. The first row is treated as a header. Uses the bundled fsaverage contour and generates a 2D plot; no template directory is required.
- --output_dir
Directory for output files. Writes: cc_mesh.html - Interactive 3D mesh visualization (HTML file) midslice_2d.png - 2D midslice visualization of the corpus callosum cc_mesh.vtk - VTK mesh file format cc_mesh.fssurf - FreeSurfer surface file cc_mesh_overlay.curv - FreeSurfer curvature overlay file cc_mesh_snap.png - Screenshot/snapshot of the 3D mesh (requires whippersnappy>=2.1). If template_dir does not contain orig.mgz and cc_up.lta, <output_dir>/mri/upright.mgz is used as the fallback reference when available; otherwise FreeSurfer surfaces are written without a reference space.
- --resolution
Legacy spacing in mm used when template contour files do not store slice positions.
Default:
1.0- --smoothing_window
Window size for smoothing the contour.
Default:
5- --colormap
Possible choices: red_to_blue, blue_to_red, red_to_yellow, yellow_to_red
Colormap progression from lower to higher values: red_to_blue, blue_to_red, red_to_yellow or yellow_to_red.
Default:
'red_to_yellow'- --color_range
Specify the range for the colorbar (2 values: min max). Defaults to automatic choice. (e.g. –color_range 0 10).
- --legend
Override the colorbar label.
- --mode
Possible choices: thickness, p-value, icc
Value type for –values_file (default: thickness).
Default:
'thickness'- --log_scale
Use logarithmic color normalization for –values_file.
Default:
False- --upper_threshold
Color values above this limit with –threshold_color.
- --threshold_color
Matplotlib color for values above –upper_threshold (default: gray).
Default:
'gray'- --title
Optional title for a 2D values plot.
- --output_name
Filename for the 2D PNG within –output_dir.
- --twoD
Generate 2D visualization instead of 3D mesh.
Default:
False- -v, --verbose
Log debug output as well.
Default:
False
Usage Examples
3D Visualization
To visualize a 3D template generated by fastsurfer_cc.py (using --slice_selection all --save_template_dir ...),
point the script to the exported template directory:
export FASTSURFER_HOME=${FASTSURFER_HOME:-/path/to/FastSurfer}
python3 $FASTSURFER_HOME/CorpusCallosum/cc_visualization.py \
    --template_dir $HOME/my_fastsurfer_analysis/subjectX/cc_template \
    --output_dir $HOME/my_fastsurfer_analysis/subjectX/cc_visualization
2D Visualization
To visualize a 2D template (using --slice_selection middle --save_template_dir ...):
export FASTSURFER_HOME=${FASTSURFER_HOME:-/path/to/FastSurfer}
python3 $FASTSURFER_HOME/CorpusCallosum/cc_visualization.py \
    --template_dir $HOME/my_fastsurfer_analysis/subjectX/cc_template \
    --output_dir $HOME/my_fastsurfer_analysis/subjectX/cc_visualization \
    --twoD
The template’s thickness_values_<slice>.txt is a per-contour-vertex file,
not a one-value-per-level-path profile. Each thickness measurement occurs at
both ends of its level path, so the non-empty measurements follow the contour
as anterior-to-posterior and then posterior-to-anterior. Do not copy a JSON
thickness_profile directly into this template file.
To visualize a one-column CSV of p-values on the bundled fsaverage contour, where the first row is a header and the remaining rows contain positive values ordered from anterior to posterior:
export FASTSURFER_HOME=${FASTSURFER_HOME:-/path/to/FastSurfer}
python3 $FASTSURFER_HOME/CorpusCallosum/cc_visualization.py \
    --values_file $HOME/my_fastsurfer_analysis/p_values.csv \
    --output_dir $HOME/my_fastsurfer_analysis/visualizations \
    --mode p-value \
    --colormap yellow_to_red \
    --log_scale \
    --upper_threshold 0.05 \
    --threshold_color gray \
    --twoD
The --values_file format is also the supported way to visualize a
thickness_profile copied from the FastSurfer JSON output: write its values
once, in their existing anterior-to-posterior order, beneath a single header
such as thickness and select --mode thickness.
For the default midslice metrics file, jq can create this input without
changing the order:
jq -r '"thickness", .thickness_profile[]' \
    $HOME/my_fastsurfer_analysis/subjectX/stats/callosum.CC.midslice.json \
    > $HOME/my_fastsurfer_analysis/subjectX/thickness_profile.csv
The same command can be run from a FastSurfer container without installing
FastSurfer or FreeSurfer on the host. From the directory containing
p_values.csv:
mkdir -p visualizations

docker run --rm \
    --user "$(id -u):$(id -g)" \
    --volume "$PWD/p_values.csv:$PWD/p_values.csv:ro" \
    --volume "$PWD/visualizations:$PWD/visualizations" \
    --entrypoint /fastsurfer/tools/Docker/entrypoint.sh \
    deepmi/fastsurfer:latest \
    python3 /fastsurfer/CorpusCallosum/cc_visualization.py \
    --values_file "$PWD/p_values.csv" \
    --output_dir "$PWD/visualizations" \
    --mode p-value \
    --colormap yellow_to_red \
    --log_scale \
    --upper_threshold 0.05 \
    --threshold_color gray \
    --legend "p-value (log scale)" \
    --title "Example p-value visualization" \
    --output_name p_values_fsaverage_2d.png \
    --smoothing_window 0 \
    --twoD
The output is written to visualizations/p_values_fsaverage_2d.png. On macOS, the
--user option can be omitted if Docker Desktop reports a user-mapping
problem.
The following example uses 100 smoothly varying dummy p-values. Values above 0.05 are shown in gray; the remaining values use a logarithmic yellow-to-red scale.
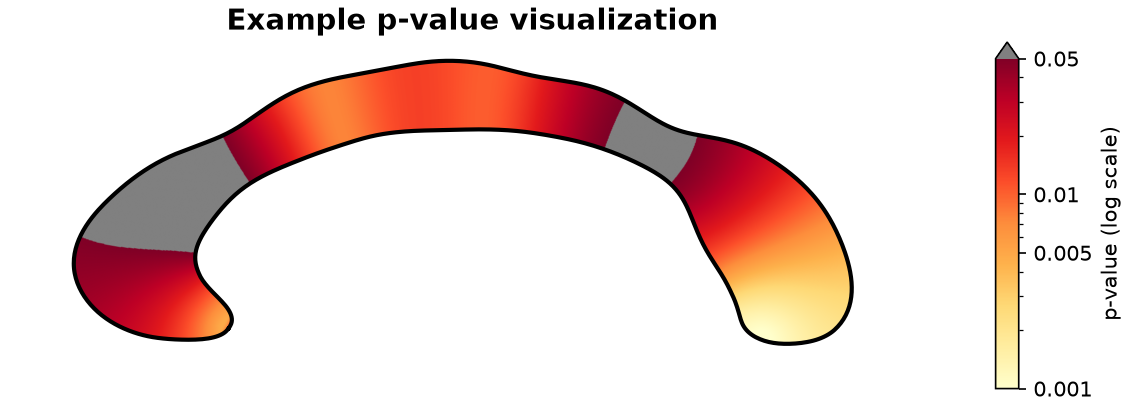
A 2D p-value visualization generated by the container command above.
Note
Use --template_dir to load templates produced by fastsurfer_cc.py.
--values_file instead uses a precomputed fsaverage corpus-callosum
contour bundled with FastSurfer. It does not require FREESURFER_HOME or
a separate FreeSurfer installation.
Outputs
- 3D Mode Outputs (default):
cc_mesh.vtk: VTK format mesh file for 3D visualizationcc_mesh.fssurf: FreeSurfer surface formatcc_mesh_overlay.curv: FreeSurfer overlay file with thickness valuescc_mesh.html: Interactive 3D mesh visualizationcc_mesh_snap.png: Snapshot image of the 3D meshmidslice_2d.png: 2D visualization of the middle slice
- 2D Mode Outputs (when
--twoDis specified): cc_thickness_2d.png: 2D contour visualization with thickness colormapThe filename passed to
--output_namefor--values_fileinput